The KPIs that matter now are AI citation share of voice, the citation gap against your rankings, AI referral conversion rate, and branded search growth. Rankings and raw organic sessions measure a behavior that is disappearing, because most searches resolve without a click and most AI influence never appears in your analytics at all.
The reporting layer broke before most dashboards noticed
For twenty years, SEO ran on three numbers: ranking position, organic sessions, and click-through rate. Every one of them quietly assumes the same thing, that the user actually clicks through to a site.
For most searches now, that no longer happens. SparkToro’s clickstream analysis found 68.01% of US Google searches ended without a click in the first four months of 2026, up from 60.45% in 2024, and that figure comes from behavioral data through Similarweb rather than people guessing at their own habits in a survey. When an AI Overview shows up, click-through rates fall by close to 60% (SparkToro, 2026). Inside Google’s AI Mode, the zero-click rate hits 93% (Seer Interactive, 2026). And in a randomized field experiment on 1,065 US participants, organic clicks dropped 38% when AI Overviews appeared, and zero-click rates climbed from 54% to 72% (Agarwal and Sen, SSRN, April 2026). The part that should worry you is the last finding from that study: nobody seemed to mind. Satisfaction scores held steady. People got their answer and moved on.
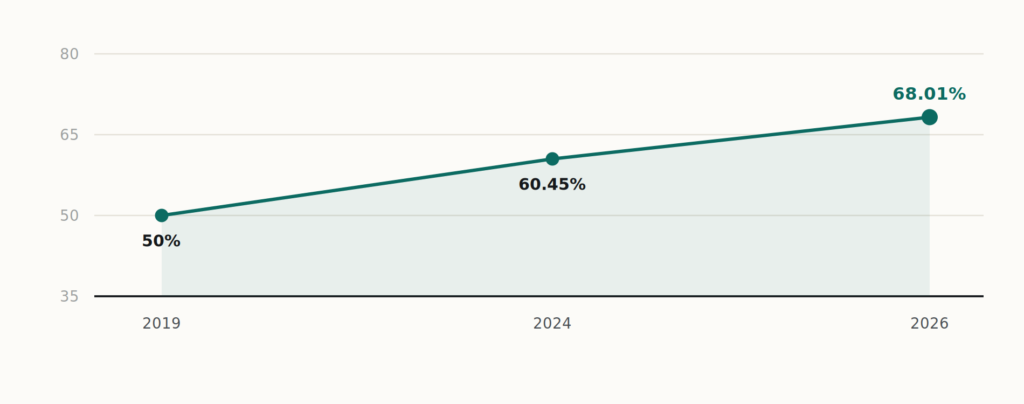
Zero-click rate, US Google search. Source: SparkToro / Similarweb clickstream, 2026; baseline first quantified by SparkToro and Datos, 2019.
It would be a mistake to pin all of this on AI Overviews, though. The zero-click rate has been climbing since 2019, when SparkToro and Datos first put it around 50%, and SERP features had already been quietly absorbing clicks for a decade before any of this. What AI surfaces did was take a slow trend and compress years of it into a handful of quarters (Digital Applied, 2026).
Here is what that does to measurement. A brand can be growing its influence, its citations, and its revenue at the same time its organic sessions are sliding, and the old dashboard will read that as a failure. It isn’t failing. The dashboard is just pointed at the wrong instrument. The job now is to measure visibility where visibility actually happens, and to stop confusing the metrics that predict revenue with the ones that only count clicks.
A KPI hierarchy, not a KPI list
Most articles on this hand you a flat list of shiny new metrics and call it a day. A list isn’t a system, though. These numbers only mean something in relation to each other, sorted by what they actually predict.
It breaks into three tiers. Inputs are the things you actually do to earn presence. Outputs tell you whether the machines started naming you because of it. Outcomes tell you whether any of that turned into money. The easiest way to hold it in your head: inputs are the levers you pull, outputs are the early signal the levers are working, and outcomes are the proof you bring to the people who fund the work.
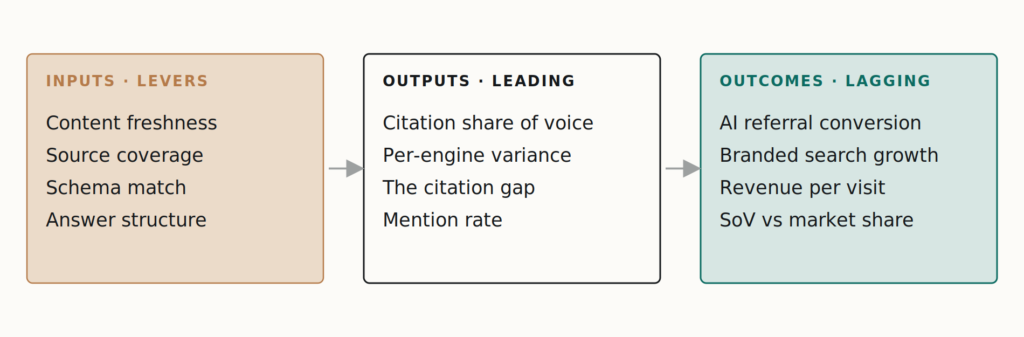
The measurement system. Inputs are levers, outputs lead, outcomes prove it paid. Framework: Tropicon Digital.
KPI 1: AI citation share of voice
Citation share of voice is the percentage of category citations that name your brand, measured against every competitor across a fixed prompt set. It is the closest functional replacement for the rankings report, and the single most actionable GEO metric, because it tells you who is taking the position you want (Otterly, 2026).
The formula itself is simple: your brand’s citations across all engines for a query set, divided by total citations for every tracked brand, times one hundred (AuthorityTech, 2026). The math is the easy part. Where almost everyone gets this wrong is the measurement design sitting behind it.
AI outputs are sampled from probability distributions. The same prompt run twice rarely returns the same ordered list of brands, and variance is highest precisely on the competitive ranking questions marketers care most about (LLM Pulse, 2026). Citations shift 40% to 60% month to month for identical queries (ASEO and Profound, 2025 to 2026). A brand that appears in 40% of responses to a prompt will be invisible to a single spot check roughly 60% of the time (Siftly, 2026).
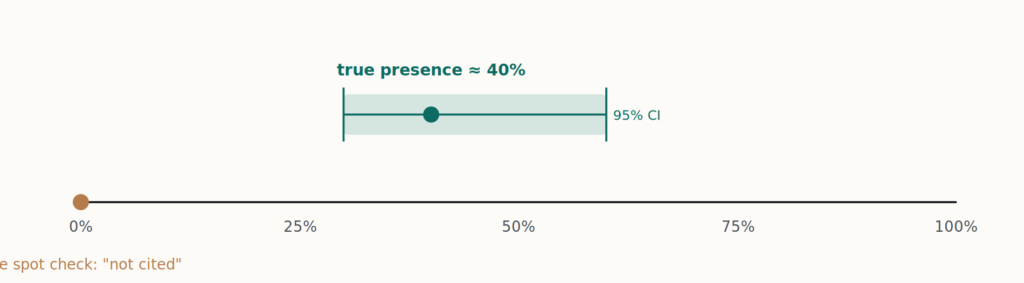
Why one run is not a measurement. The confidence band is the deliverable, not the point estimate. After Siftly and Maximus Labs methodology, 2026.
Which leads somewhere uncomfortable. A citation number pulled from a single run is basically noise wearing the costume of a signal. To get something you can trust, you need at least 3 to 5 runs per prompt per engine, and the rigorous end of the field runs 30 passes per query per platform and reports a 95% confidence interval (Maximus Labs methodology, 2026). The band is what you actually report, not the tidy single number sitting in the middle of it. Any vendor who hands you one mention rate with no interval attached is quietly hiding how much that number moves.
Prompt set design matters just as much. Build 30 to 100 prompts out of the questions real buyers actually ask, grouped by funnel stage, definition, problem-aware, comparison, decision (Contently, 2026). Then freeze the set between cycles, because the moment you start swapping prompts mid-program, your month-over-month comparison stops meaning anything. Weight the discovery-stage prompts heavily while you’re at it, since buyer behavior has moved upstream: 35% of US consumers now reach for AI tools at the product-discovery stage, against 13.6% who still start with traditional search (Contently, 2026).
One discipline above all. Publish the formula, the prompt set, and the engines measured next to every number. Share of voice is directional, and an undisclosed methodology makes the figure impossible to interpret or repeat (Digital Applied, 2026).
KPI 2: Per-engine variance, because there is no single AI search
Reporting one blended AI visibility score hides the most important operational fact in the channel. The major engines barely cite the same sources. A 2026 per-engine audit found that only 11% of the domains ChatGPT cites overlap with the domains Perplexity cites (Digital Applied, 2026).
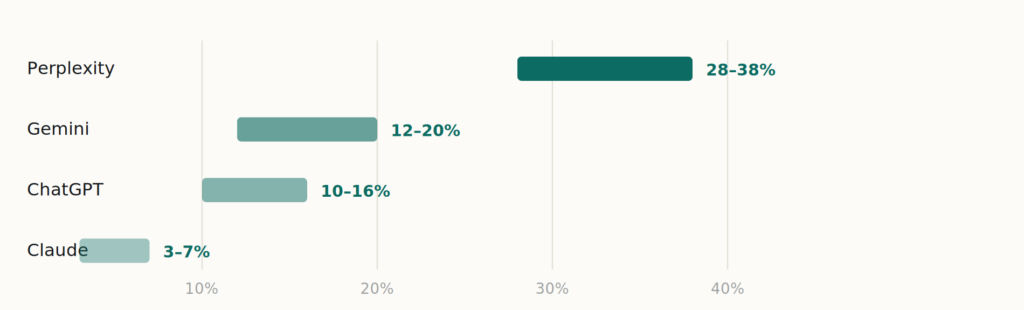
Citation share of voice by engine, same brand and prompt set. One brand, four verdicts. Source: AuthorityTech, 2026.
None of this is a glitch in the tracking. The engines genuinely pull from different places. ChatGPT leans heavily on Reddit and Wikipedia, Google’s AI Overviews tend to favor brand-owned sites, and Perplexity rewards recent, definition-first, citation-dense pages (Otterly, 2026). The ranking data backs up the split: an Ahrefs analysis of 15,000 prompts found only 12% of AI-cited URLs rank in Google’s top 10 on average, with Perplexity the outlier at 28.6% and everyone else sitting near 8% (Ahrefs, 2026).
So the number worth watching is the variance between engines, treated as a diagnostic rather than a scoreboard. If you’re getting cited on ChatGPT but you’re invisible on Perplexity, that gap is telling you something specific: your content isn’t built the way Perplexity’s retrieval likes it. A single blended visibility score would have buried that signal completely. Track the engines that matter for your category on their own terms, and let the disagreement between them point you at the fix.
KPI 3: The citation gap
The citation gap is the distance between where you rank and whether you actually get cited, and it might be the single most useful thing you can put in an AI-era audit, because it turns a vague worry into a sorted to-do list.
Build it as a plain report: every priority keyword, your organic position next to it, and a yes or no on whether the AI surface for that query names you. The patterns jump out fast. A page sitting at position two with no citation has a structural problem, usually a buried answer, thin sourcing, or copy a competitor could publish word for word. A page languishing at position fifteen that somehow keeps earning citations is holding authority the rankings report can’t see, and it’s quietly telling you what to make more of.
The gap exists because ranking and citation are now separate systems with separate rules. Ranking number one in Google gives only a 17% to 54% chance of inclusion in the AI Overview (QuickSEO, 2026). In AI Mode, just 14% of cited URLs rank in Google’s top 10 (SE Ranking, 2026). Google Search Console shows your impressions and clicks. It does not show whether you sit inside the AI Overview box. The space between those two layers is now its own metric (QuickSEO, 2026).
One word on the inputs, since the citation gap points you toward fixes and the fixes get misdiagnosed constantly. An Ahrefs difference-in-differences study across 1,885 pages found that schema markup had no statistically significant effect on AI citation, not in AIO, not in AI Mode, not in ChatGPT. What did move the needle was content-match schema, structured data that mirrors the text actually rendered on the page. Generic or empty FAQPage entries did more harm than good (Ahrefs, May 2026). Piling on schema for its own sake closes no gaps.
KPI 4: AI referral conversion rate, reported as its own channel
AI referral traffic is tiny in volume and unusually good in quality, and if you bury it inside a generic referral bucket you throw away the one thing that makes it worth watching.
The conversion premium is the story. Similarweb’s clickstream data shows that ChatGPT referral traffic converts at 7.1%, second only to paid search at 7.8% and ahead of organic, direct, social, and email. Ahrefs found AI visitors converting at 23 times the rate of organic, where 0.5% of total visitors from AI drove 12.1% of signups. Seer Interactive measured Perplexity converting at 10.5% against Google Organic at 1.76% on the same client (Seer Interactive, 2026). AI-referred visitors spend 68% more time on site than organic visitors (SE Ranking, 2025).
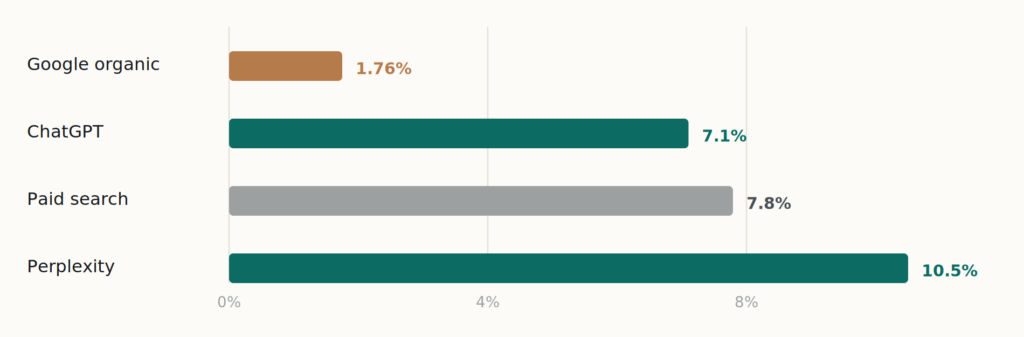
Conversion rate by acquisition channel. AI referrals convert like paid, and sometimes beat it. Sources: Similarweb (April-May 2026); Seer Interactive (2026).
The reason isn’t mysterious. By the time someone clicks through, the engine has already named the brand inside its answer, so they arrive to confirm a recommendation rather than to start browsing. That’s a completely different headspace from a cold search result, and it’s why these sessions convert at several times the rate of organic.
This metric earns its keep as a comparison, not on its own. Put AI referral conversion next to organic, direct, and paid for the same period, and you answer the question leadership is really asking: is AI just adding sessions, or is it sending people who arrive closer to buying. Pair it with visible AI traffic share too, because a category can pull modest AI volume and still show unusually strong conversion quality from the visits it does get (Demand Local, 2026).
KPI 5: Branded search growth, the leading indicator nobody tracks
When an engine mentions a brand but doesn’t hand the user a clickable link, what does the user do next? Usually they go search the brand name. And that behavior lands in exactly one measurable place: branded query volume in Google Search Console.
That makes branded search the earliest read you get on AI visibility. A brand picking up citations across ChatGPT and AI Overviews will see its branded impressions climb weeks before any trackable referral shows up in analytics. The SERP then doubles down on it: branded queries with an AI Overview present see click-through rise by 18.68%, because the overview vouches for the brand and the user clicks through to do something (Amsive, 2025).
So set the baseline now. Track branded impressions and branded clicks every month. Branded demand rising while non-branded traffic stays flat is the fingerprint of a brand winning the citation layer before the revenue has caught up. It’s the most honest early signal you have, which is the whole reason it belongs on the dashboard.
KPI 6: Revenue per visit, because sessions are no longer comparable
Sessions stopped being comparable across channels the moment the intent behind them split apart. The fix is to report revenue per visit, or pipeline per visit if you’re B2B, and to take raw session counts off the headline line altogether.
Once you do that, the priorities reshuffle on their own. A client can shed 30% of their organic sessions, pick up AI referrals that convert at four times the rate, and still come out ahead on revenue (Conductor, 2026). Informational queries now run a 74% zero-click rate against 31% for transactional ones, which means top-of-funnel content has quietly turned into a citation play rather than a traffic play. A team still cranking out what-is and how-to posts to chase blog sessions is measuring the wrong thing entirely, because the real scorecard for that content is now citation frequency and brand recall (Omnibound, 2026).
Revenue per visit is the number that explains why a falling traffic line and a rising revenue line can describe the same healthy program.
The measurement architecture, and where it lies to you
A KPI framework is only as honest as the plumbing underneath it, and in 2026 that plumbing has a known leak. Most AI influence simply doesn’t show up in standard analytics, and the tools will cheerfully report the slice they can see as if it were the whole thing.
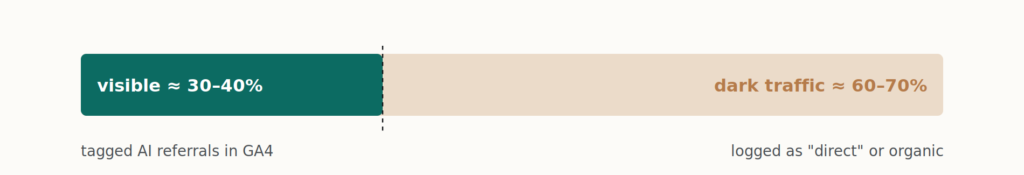
The exact percentage matters less than the mechanism, which is well understood. ChatGPT only started appending a UTM tag in June 2025, and it still drops attribution entirely on mobile app traffic. Google’s AI Overviews and AI Mode pass no attribution data at all, so whatever influence they carry just surfaces as ordinary organic search (Digital Applied, 2026). GA4 did add a native AI Assistant channel in May 2026 that picks up ChatGPT, Gemini, and Claude, but only when the referrer header survives the trip, which means the dark fraction stays dark (AuthorityTech, 2026).
Four moves build a stack that accounts for all this instead of pretending it away.
One. Run an AI citation monitor on a frozen prompt set with multi-run sampling and confidence intervals. Otterly, Peec AI, Profound, and Slate cover this, including AI Overview presence. This is the only path to share of voice, because the engines generate answers with no referrer log and scheduled prompt execution is the sole way to observe them (Siftly, 2026).
Two. Build a custom GA4 channel group with regex covering 30-plus AI referrers, sequenced ahead of the generic referral catch-all so AI sources are captured before they fall through. Pair it with GA4’s native AI Assistant channel, since neither alone is complete. Document the configuration date, because channel-group changes apply only to sessions collected after the change and never reprocess history. Comparing pre- and post-configuration data as one definition is a self-inflicted reporting error (Swydo and Influencers Time, 2026).
Three. Baseline branded query volume in Search Console and report its monthly trend as the leading indicator described above.
Four. Add one question to the post-purchase or lead flow: where did you first hear about us. It is the only instrument that recovers the AI-influenced conversions GA4 logs as direct, and it is the cheapest line item in the entire stack.
One more thing, because it’s the misread that catches the most people. AI usually does its work early, as an awareness touchpoint, which means last-click attribution will hand the credit to whatever channel happened to close the deal while AI did the actual lifting. Run data-driven attribution instead of last-click, or the dark traffic problem quietly turns into a dark influence problem (Swydo, 2026).
Why the inputs point at earned media, not your blog
By now the output and outcome KPIs keep circling back to one uncomfortable input, and an honest framework should just say it. Somewhere between 82% and 85% of AI citations come from third-party sources rather than brand-owned sites, and Reddit threads alone pull roughly 6.5 times more citations than brand pages do (Meltwater GenAI Lens, via AuthorityTech, 2026). Freshness piles on top of that: about 50% of cited content was published within the previous 13 weeks (AuthorityTech, 2026).
Two things follow from that. First, earned media and third-party presence move citation share of voice far more reliably than yet another post on your own blog, so any serious content program has to play on the surfaces the engines actually trust. Second, running a quarterly measurement cadence with no content refresh strategy means you’re watching your share of voice decay in real time, because the citation pool turns over every quarter. Weekly iteration with the measurement loop feeding back in is the cadence that holds up. One documented case climbed from 2.0% to 12.6% share of voice in 60 days by doing exactly that, applying content edits weekly against what the measurement was telling them (Gruns case study, AthenaHQ, 2025).
The strategic number underneath all of it
There’s one number that turns this whole framework from a reporting chore into an actual business case: the gap between your AI share of voice and your traditional market share.
Say you hold 30% market share but only 8% AI share of voice. That means you’re losing the discovery layer to smaller competitors who started optimizing for citation before you did, and that gap is where the urgency lives. There’s even precedent for it in older research: the Nielsen and Binet and Field work across 171 campaigns found that every 10% of excess share of voice you hold above your share of market buys you roughly 0.5% of market share over time. AI share of voice is just the 2026 version of the same mechanic. Build excess citation share now, and it compounds into market share later.
What to put on the dashboard, and what to take off
Take average ranking off the headline. Stop treating organic sessions as a success metric on their own, and quit chasing click-through rate on informational queries as if it were still a goal.
In their place, six numbers:
- Citation share of voice, with confidence intervals, segmented by engine
- The citation gap on your priority keywords
- AI referral conversion rate against channel baselines
- Branded search growth as the leading indicator
- Revenue per visit in place of session counts
- The gap between AI share of voice and market share, as the one slide that explains why the program exists
None of this is a loss you have to manage your way out of. It’s a filter. Fewer people click, but the ones who do convert at multiples of organic, because the engine already vetted you before they ever moved. Which leaves two questions actually worth measuring: are you the source the machines cite, and does that citation turn into revenue. Everything above is just a way of answering those two honestly.